
Phase analysis in X-Ray-diffractometries
- Contact:
apl. Prof. Dr.-Ing. Markus Reischl
Jan Schützke
- Project Group:
Machine Learning for High-Throughput Methods and Mechatronics (ML4HOME)
- Partner:
Bruker AXS
- Startdate:
2018
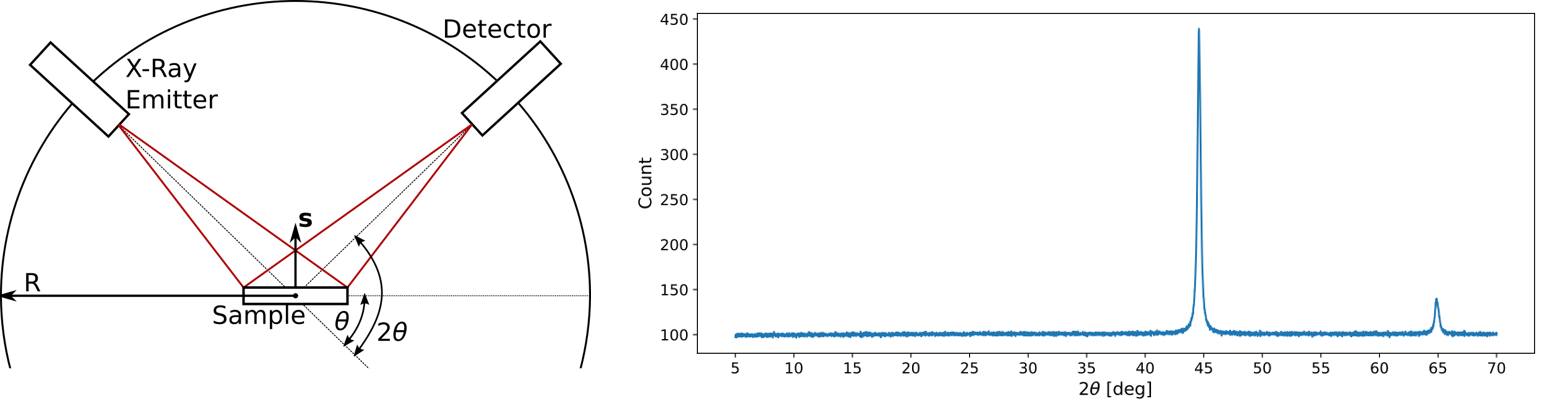
Spectroscopic data comes from a variety of different measurement techniques in the domains of material science or chemistry and is characterized by a sequence of intensity peaks in an one-dimensional signal. Typically, the measurement records an oscillating signal that is transformed into the frequency domain through Fourier transformation which splits the signal into separate frequencies with different fractions. Alternatively, the mass spectroscopy technique is able to measure the spectrogram directly, using the time-of-flight information. Other measurement technique are typically not classified as spectroscopic methods, but generate one-dimensional signals with identical properties as spectrograms. For example, in X-ray diffraction (XRD), a powder sample of an inorganic crystalline material is irradiated with X-rays and the intensity of diffracted radiation is measured with respect to diffraction angle 2θ. The resulting diffraction pattern acts as a fingerprint of the analyzed material: the position and number of peaks gives insight about the underlying crystal structure and the relative peak intensities are related to the types of atoms in the crystal.
Similarly, the spectrogram of other spectroscopic techniques are used to characterize materials, molecules or other samples. Most of the techniques are known for many years, so there exist databases for comparison and matching with known substances. However, the classification of spectrograms is typically not a straightforward pattern matching approach, as naturally occurring variations (due to defects, uncertainties of the measurement, etc.) of peak positions or heights complicate the analysis.
Alternatively, machine or deep learning models can be trained with recorded or simulated signals for automatic classification of the spectroscopic patterns. Those models use the raw signals as input and output probabilities for a list of candidates. Using a diverse training set, the models are able to reduce variations present in the spectrograms and learn robust classification rules for the identification of substances.
Publications
Schuetzke, J.; Szymanski, N. J.; Reischl, M.
2023. npj Computational Materials, 9 (1), 100. doi:10.1038/s41524-023-01055-y
Schuetzke, J.; Szymanski, N. J.; Ceder, G.; Reischl, M.
2022, August 24. 33rd European Crystallographic Meeting (ECM 2022), Versailles, France, August 23–27, 2022
Schützke, J.; Szymanski, N. J.; Reischl, M.
2022. doi:10.5445/IR/1000148149
Reischl, M.; Schützke, J.
2022. DGK München
Schuetzke, J.; Benedix, A.; Mikut, R.; Reischl, M.
2021. IUCrJ, 8 (3). doi:10.1107/S2052252521002402
Schützke, J.; Jones, B.; Henderson, N.; Rodesney, N.; Benedix, A.; Knorr, K.; Mikut, R.; Reischl, M.
2020. Denver X-Ray Conference (2020), Denver, CO, USA, August 17–20, 2020
Schützke, J.; Benedix, A.; Mikut, R.; Reischl, M.
2020. Proceedings - 30. Workshop Computational Intelligence : Berlin, 26. - 27. November 2020, 17–31, KIT Scientific Publishing